


Visa Inc. is a company that almost everyone is familiar with; a financial network firm that operates in worldwide commerce made up from consumers, businesses, and governments all interacting with one another, generating $200 trillion worth of payment flows in 2025. Visa’s core fundamental to being the leading frontier in the payment processing industry is beyond just being a financial intermediary for capital flow, but, as an entity that facilitates free trade, connecting consumers and producers from different hemispheres, transacting distinct currencies in diverse respective economies, all performed behind the scenes.
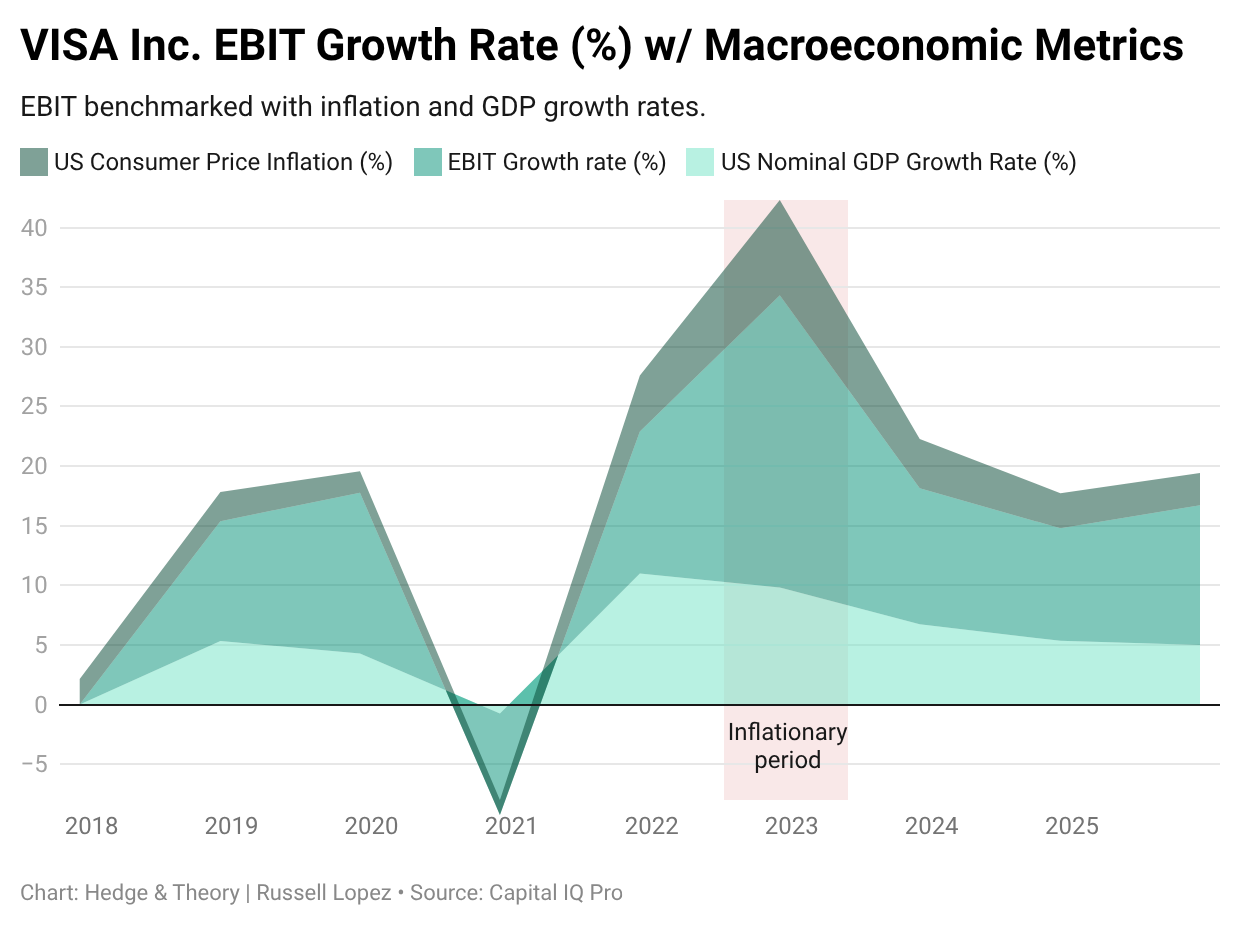
At first glance, how can a business in such a strong position face determential risks? Especially one where its brand is synonymous with purchasing goods and services, where, the performance of Visa is closely tied to consumer spending, which expected to climb at around 3% annually, globally for the next 5 years. But, in fact, there are legitimate concerns with respect to uncertainty and risk which this valuation plans to not only uncover, but, reassure a bullish outlook on Visa’s future performance.
All and all, the large-cap company is revered heavily from investors but perhaps not for the obvious reasons and therefore, the objective is to solve for Visa’s true valuation, competitive advantage, and impressive underlying operating metrics that will continue to be the impetus for its success.
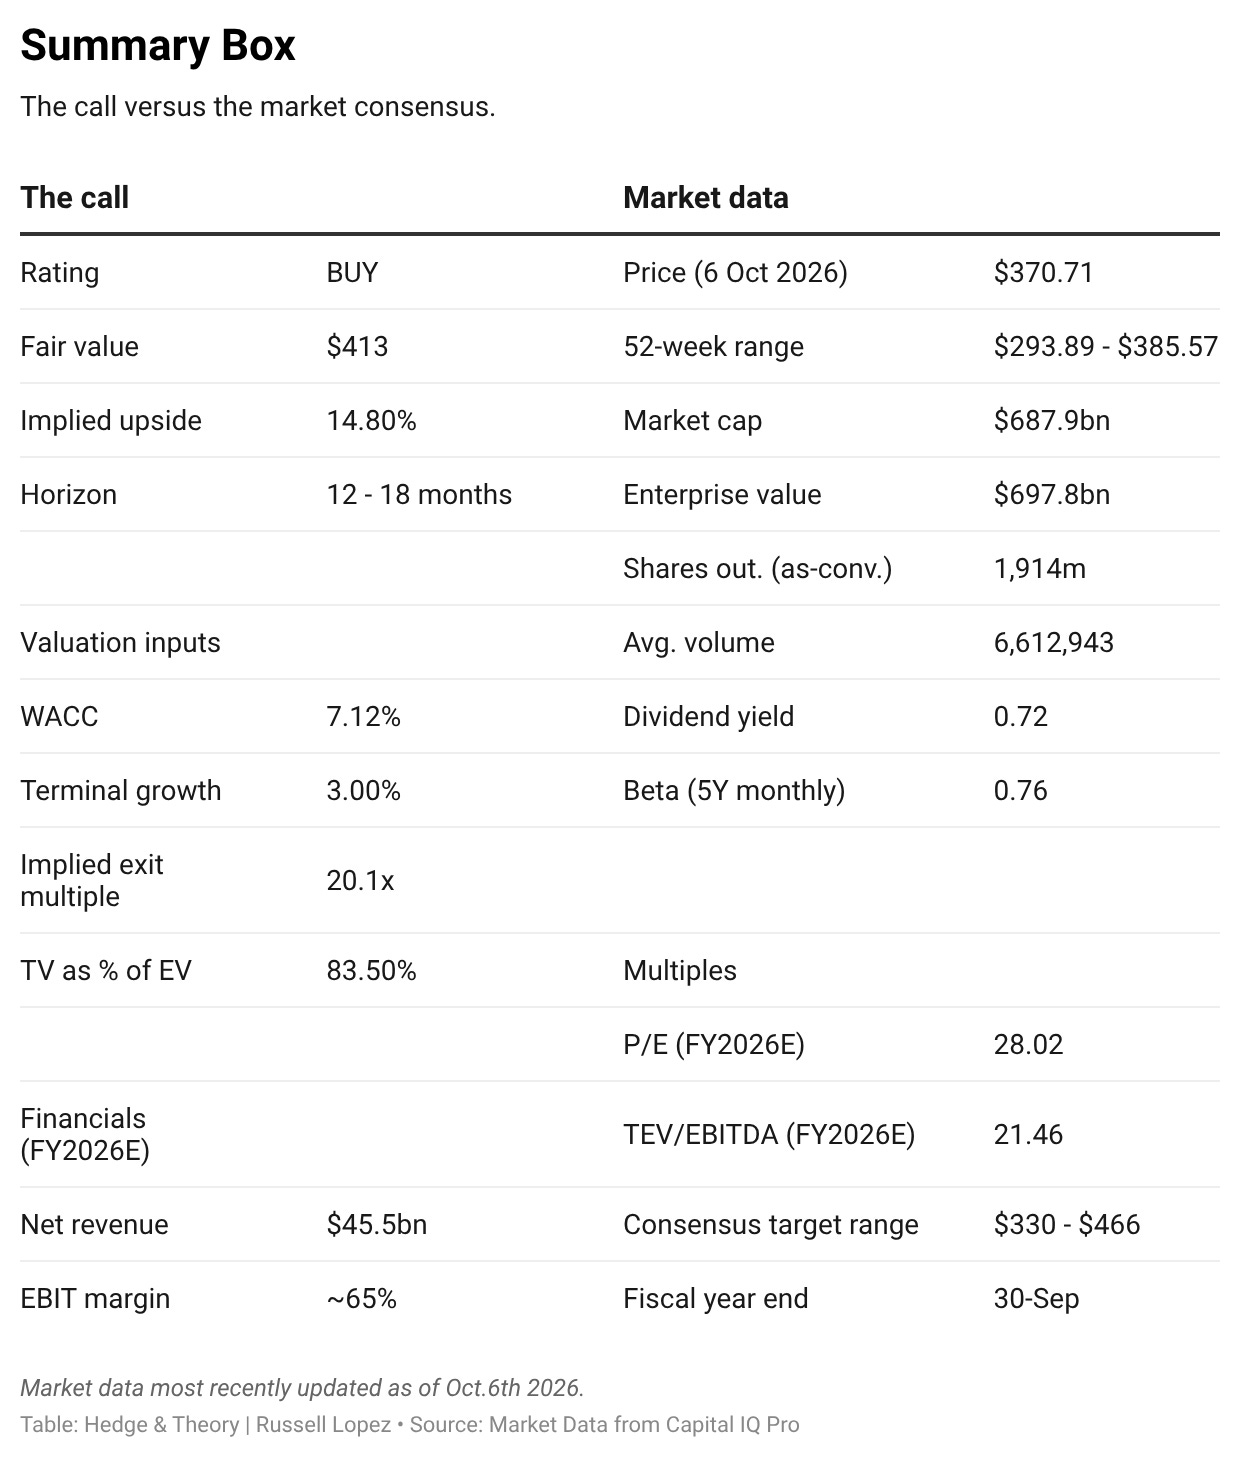
At the time of this modelling for this report was completed, the current market price was $359.61, the bearish outlook expects a fall as dramatic as -8.08% to as bullish as 29.81% for the foreseeable future. Our estimate expects an approximate 15% appreciation in the share price, let us unpack why.
The recommendation for Visa is a strong buy with a target price of $412.60.
A Primer for Visa’s Operations.
Very often, the fallacious association of Visa is made out to be a firm about banking and finance, but, Visa is not a traditional financial institution like a bank, nor do they issue cards or lend out to borrowers or even set rates for that matter.
When consumers purchase from a merchant, a simple tap from a card that takes mere seconds may seem simple but in fact a complex process happens behind the curtains; where fraud and security checks, issuer authorization, and deposit amount checks are all taken care of. This is all processed around the proprietary Visa Network composed of a linear system of four entities, whose interaction happens near instantaneously (in the matter of seconds):
Consumer → Issuer → VISA Network → Acquirer → Merchant
Last year in 2025, an average of 901 million transactions occurred everyday with our estimate expecting total payment volume to increase by 7.22% for this fiscal year of 2026. This leads us into the foundation of Visa’s business model, centred around the proprietary VISA Global Network coupled with three main drivers that funnel revenue into the company.
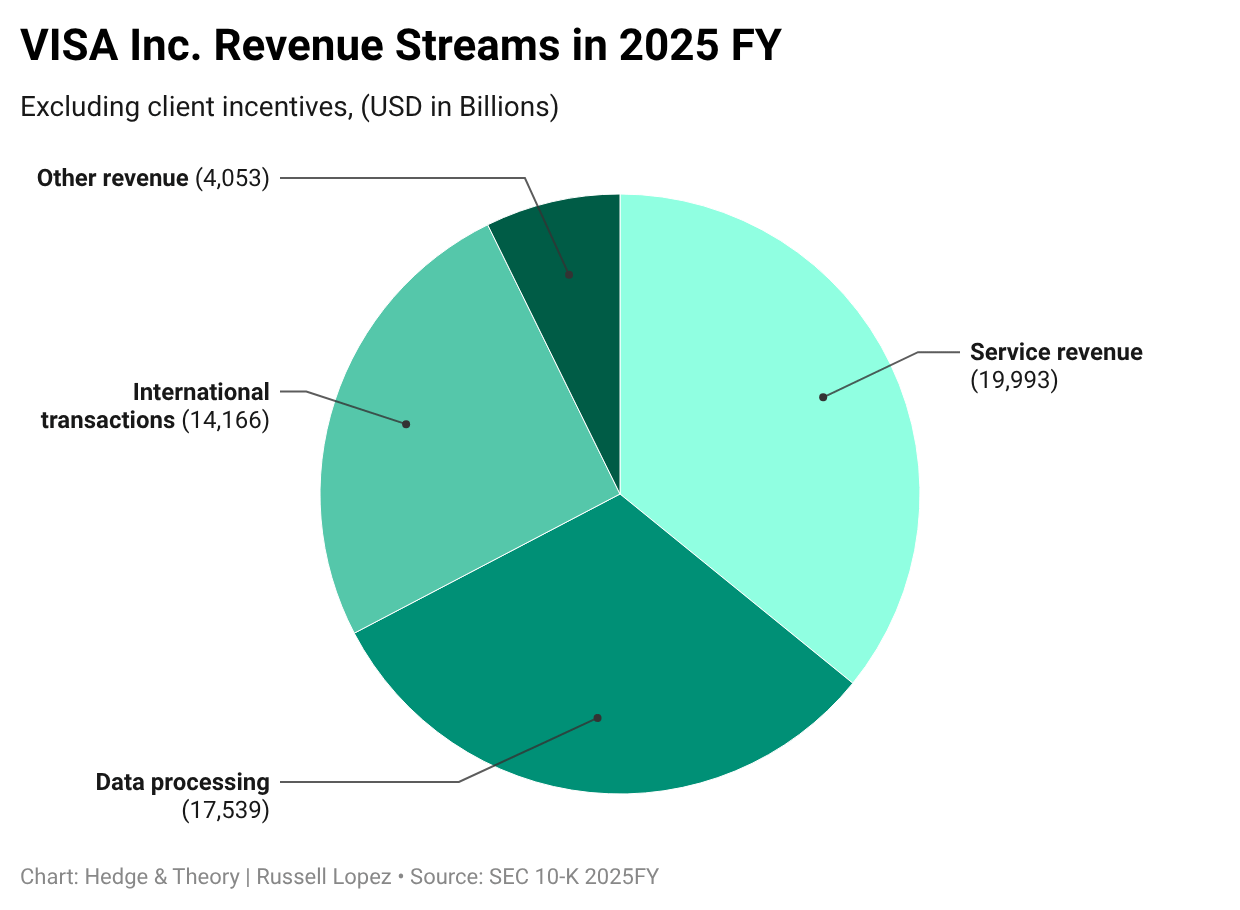
First, aggregate consumer payments, categorized as domestic payments done in the United States and cross-border payments composed of international payments. Transactions are supported with approximately 160 different currencies, this is not including the addition of Visa’s development of their own full stack stable coin (a cryptocurrency pegged to a real world currency). Once implemented, there will be a platform plan to link other stable coins and payment platforms together, if executed correct, this will facilitating the act of buying and selling in emerging markets and economies with an unstable-underlying currency. Of course, this first revenue variable is highly dependent on consumer activity and macro conditions which drive consumer spending. Hypothetically, if consumer spending were to split in half, it would spell trouble for Visa.
Second, classified as money movement solutions, the secondary revenue driver covers large payments of money beyond the typical business-to-consumer framework that frequently occurs. Allowing for commercial, businesses, and governments to transact securely, typically dealing with large sums of payments periodically. Similar to the first, money movement solutions are highly susceptible to the macroeconomic environment which dictate payment volume in this regard as well.
Third and finally, is the value-added services (classified as other revenue), a diversified revenue stream insulated from payment volume. A minority of Visa’s income but nonetheless, additional operational income that are separated from the previous two. Specifically, the value-added services can be broken down into four components, with respect to 2025 data: issuing solutions ($125B)—aids financial institutions in scaling online payments, accepting solutions ($95B)—optimizes checkout experience for business to consumer, risk & security solutions ($150B)—security apparatus and applying machine learning methods to mitigate fraud, and advisory & other solutions ($150B)—consulting to help businesses scale with strong economic intel. We will see shortly how this revenue stream is projected to grow faster than expected.
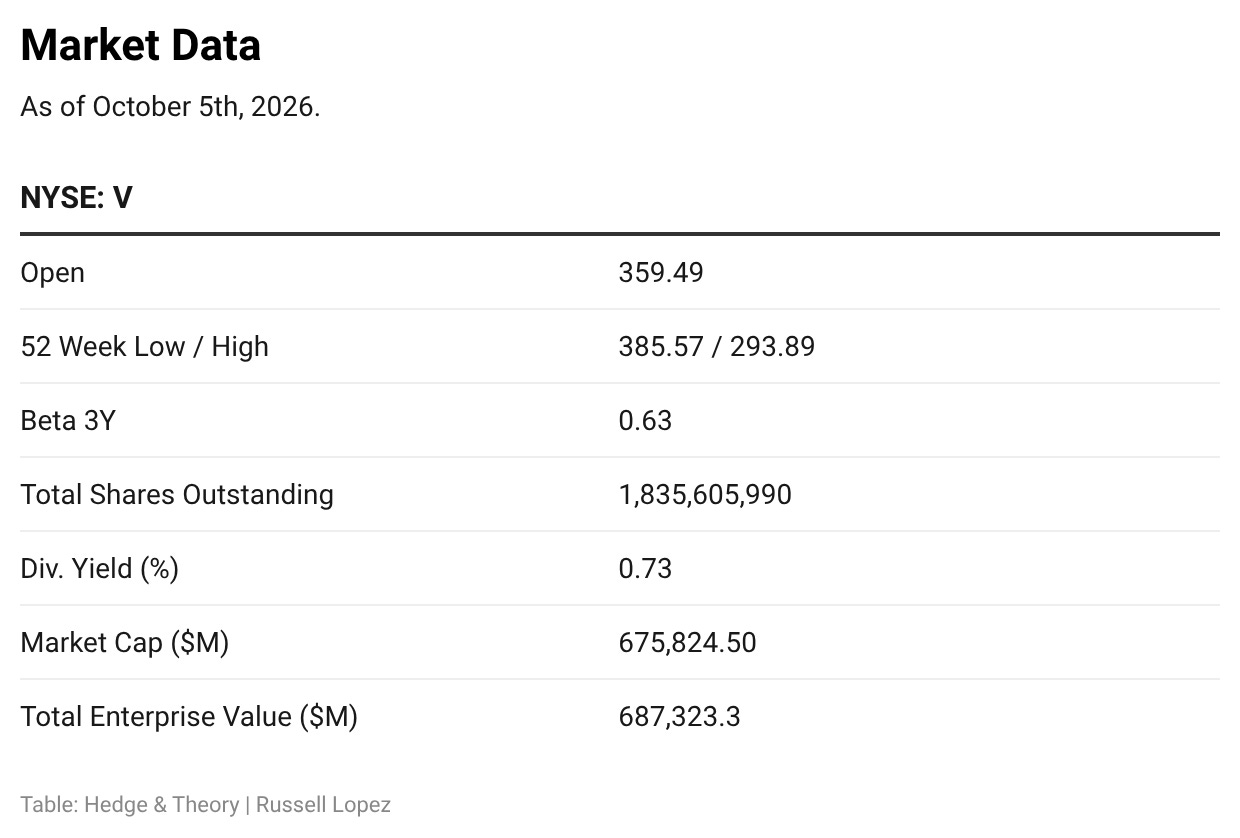
For reference, here is market opening price in October 5th, a strong entry point to go long on the equity.
Why we are bullish on Visa.
In the analysis of Visa, our findings can be organized into four main pillars that demonstrate why we are bullish (followed by the valuation after.)
Pillar 1—Cost of capital disagreement with respect to the market.
As of the writing of this report, the current market price is $359.41 (some figures may be slightly different due to obvious market price changes) with a complementary enterprise value of ~$675B. Leading as such, there are several discrepancies between the market value and our computed valuation which diverges on three major variables, these are as stated:
Perpetual growth of 2.29% instead of 3.00%
WACC of 7.72% instead of 7.12%
Client incentives at 37.5% of gross by FY2031 instead of 28.5%
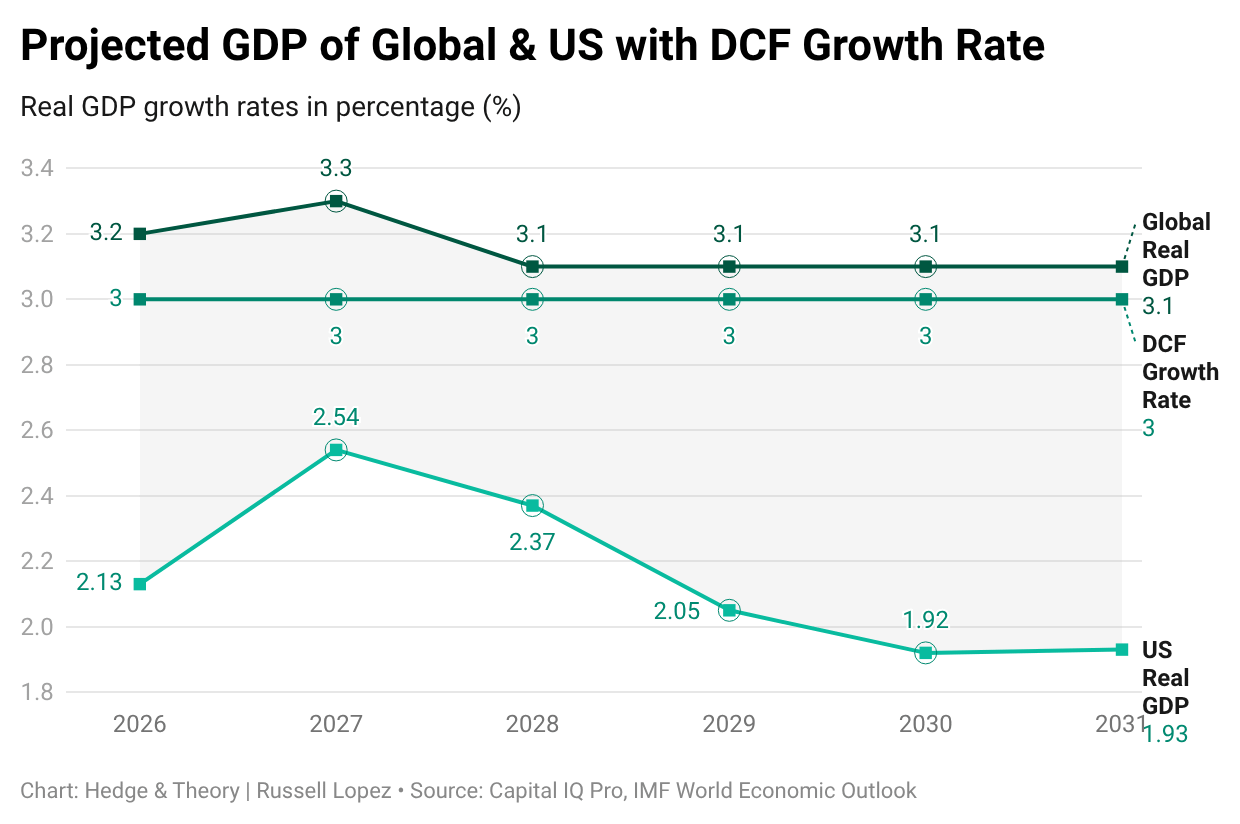
The first parameter is a minor differential in valuation analysis; the perpetual growth rate of 3% was derived from primarily GDP growth estimates from several sources, as real GDP growth is a leading variable of consumer spending which is the grand impetus for Visa’s revenue growth. Therefore, projected GDP growth in the US is expected to peak for this decade in 2027 at 2.54% then growth is expected to slump here on after. For global GDP, growth is expected to be more stable, as innovations in AI progress, growth are expected to beat supposed estimates. As a result, the DCF growth estimate consolidates at a fixed rate of 3% in between both real GDP rates, a slightly higher expectation from the market, nonetheless, a mutually agreed upon growth in the markets.
Our WACC 7.12% → implied cost of equity ≈ 7.26%
Market’s WACC 7.72% → implied cost of equity ≈ 7.88%
39.08% of revenue comes from US in 2025 FY
60.92% of revenue comes from International in 2025 FY
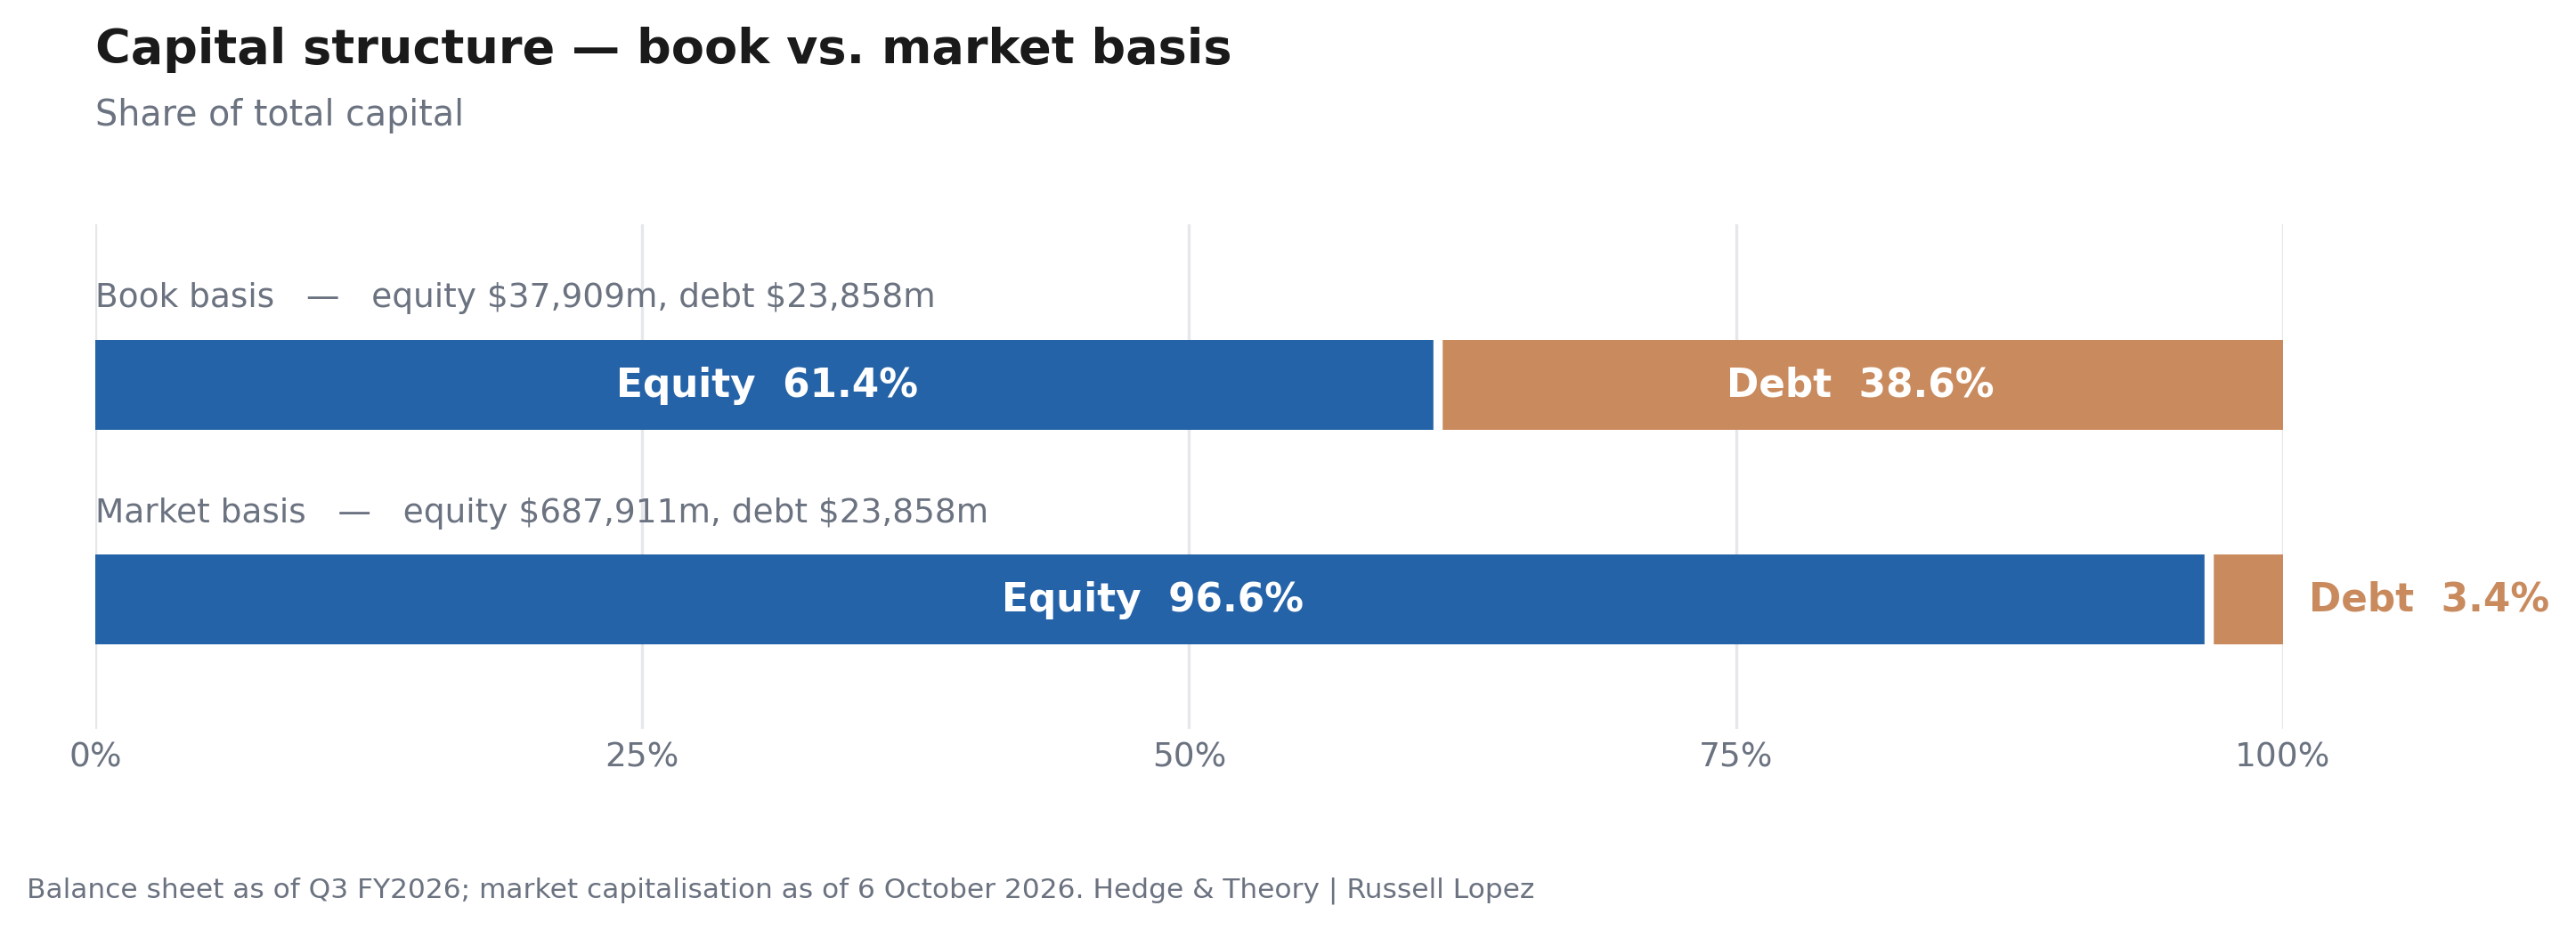
Our weighted cost of capital undershoots the market expectation due to an obvious disagreement fundamentally about risk assessment. The market’s valuation of a WACC of 7.72% puts a higher premium on Visa’s risk factor, not so much an operational disagreement within the business. There are several reasons for our generally lower WACC associated with Visa. Firstly, the firm’s lack of physical net asset infrastructure means that the business model is inherently dominated by the intangibles such as proprietary network, brand, and intellectual property. As such, that makes the business have a heavily equity-financed structure, thus, the calculation of the WACC is heavily determined by the investor’s required rate of return, this is to say most of the profit from the business will be returned to investors rather than lenders. As Visa is 96% financed from equity (market cap method), meaning that it is only 4% leveraged and carries minimal debt risk. Within that small amount of debt, current bond markets have continue to climb as yields grow due to the Fed continuing to raise federal fund rates (with an high probability of the Fed raising rates once more before 2026 concludes), thus, the 10Y treasury at 4.96% (above the historical average of 4.26%) was used.
This is ultimately to say that Visa’s equity risk is the coincided with the business risk which is also less than expected explain in our analysis on the operation frontier.
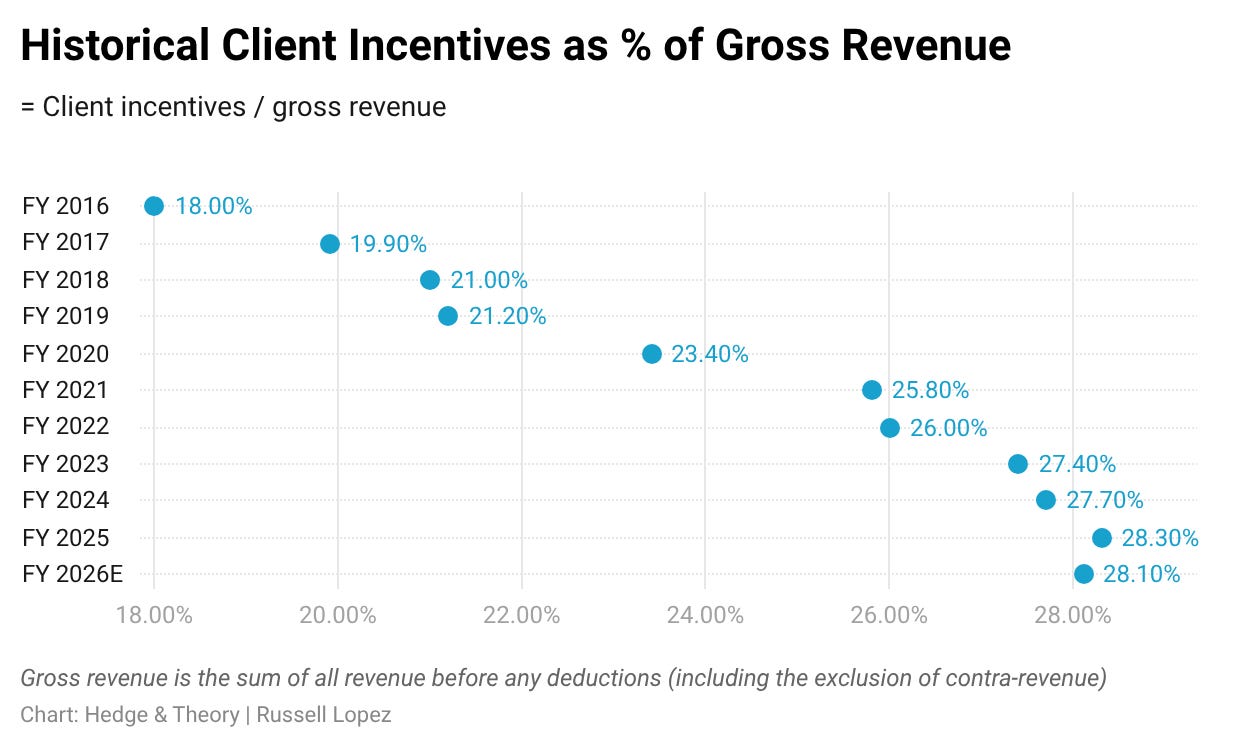
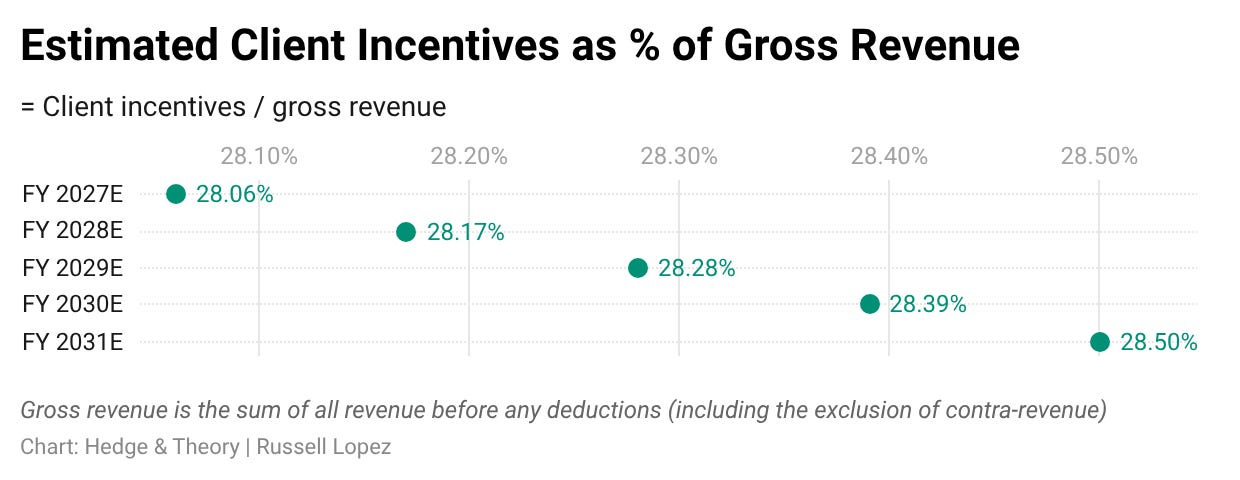
On the operational front of the business, client incentives are historically around a quarter of gross revenue, being a contra-revenue, it is necessary payments that Visa makes to banks, merchants, other financial institutions. Now, the market expects client incentive as a percentage of gross revenue surge to 37.5% by 2031, over a third of revenue, this goes against the historical average of 1.09% growth rate annually for client incentives. Such an estimation by the market means that a large chunk revenue will continue to fall, being eaten away by greater client incentives. Fundamentally, encapsulating a higher risk on operational income. In accordance to conversative estimates, we expect Visa to continue to lead as the dominant payment processor, incrementally increasing their client incentives that will sustain their market leading position. Climbing no more than 30% with our estimate being 28.50% for 2031. More on this in the next pillar which also leads to the next argument.
Lastly, all other major estimates such as revenue and payment volume align with the market expectations, more on this in the valuation section.
Pillar 2—Client incentives may be plateauing, contrary to market expectations
There is a profound finding in the estimated fiscal year for 20261, where, an inflection point occurs, the client incentives falls slightly in the first time in nine years. Presuming this is an accurate estimation, it means that in last year, in 2025, $15.75B of the $55.75B (gross revenue) was due to Visa paying out clients, a deduction that is greater than Visa’s entire operating expense base (excluding $2.6B in litigation provision). Meanwhile, all other measures in the 10-year historical data demonstrates stability; capex 2.9-3.9%, D&A 2.9%-3.5%, and yet client incentives still jumped from 18.04% to 28.25%, a 52% surge in nine years versus only a 1.22% increase in capex as % of net revenue in that same time frame.
In the end, client incentives are about bargaining power Visa and the issuers, a higher percentage of client incentives means higher business risk. Remember, our disagreements with the market do not lay in the fundamental macroeconomics, where volume is ultimately driven by nominal consumer spending, these results will be similar for all other analysts. Instead, we are proposing a possible mispricing in the cost of capital.
In the bear risks and sensitivity analysis, we will discuss further what it means for the share price if the market is correct and we are not.
Pillar 3—Demonstrated durability justifies the low discount rate.
From the 10-year historical data including the COVID-19 pandemic (which introduced demand shock to consumer spending), most relevant results are as stated:
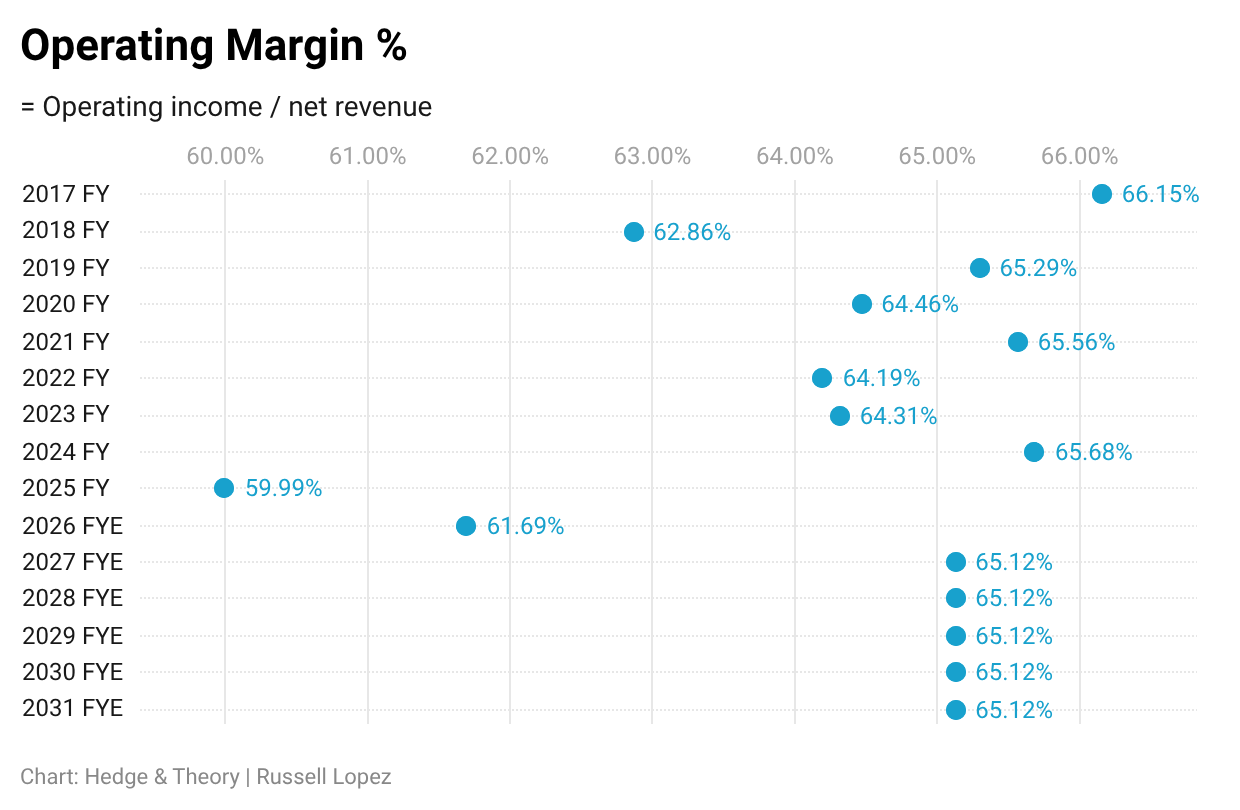
Operating margin stayed in a 64.5–67.2% band — 2.7 points of variation across a decade
Free cash flow converts at ~55% of net revenue
Capex runs ~3.4% of net revenue — there is no physical network to maintain
Working capital is negative and funds growth, because client incentive liabilities ($10.4B) exceed operating current assets ($5.8B)
Throughout the pandemic cycle, Visa’s margins stayed relatively stable despite demand shocks putting downward pressure on consumer spending in 2020. Furthermore, the lack of tangible capital to maintain coupled with a net cash outflow being generated infers excess growth will grow cash rather than consuming it. Hence, a change in net working capital is not be largely determined by capex or D&A costs, but rather, client incentives as a % of gross revenue. Our model suggests that Visa will maintain this contra-revenue stable as digitalization, free trade, and commerce continue to grow, Visa’s network is imperative to facilitate payments globally.
Pillar 4—Revenue growth beyond payment volume.
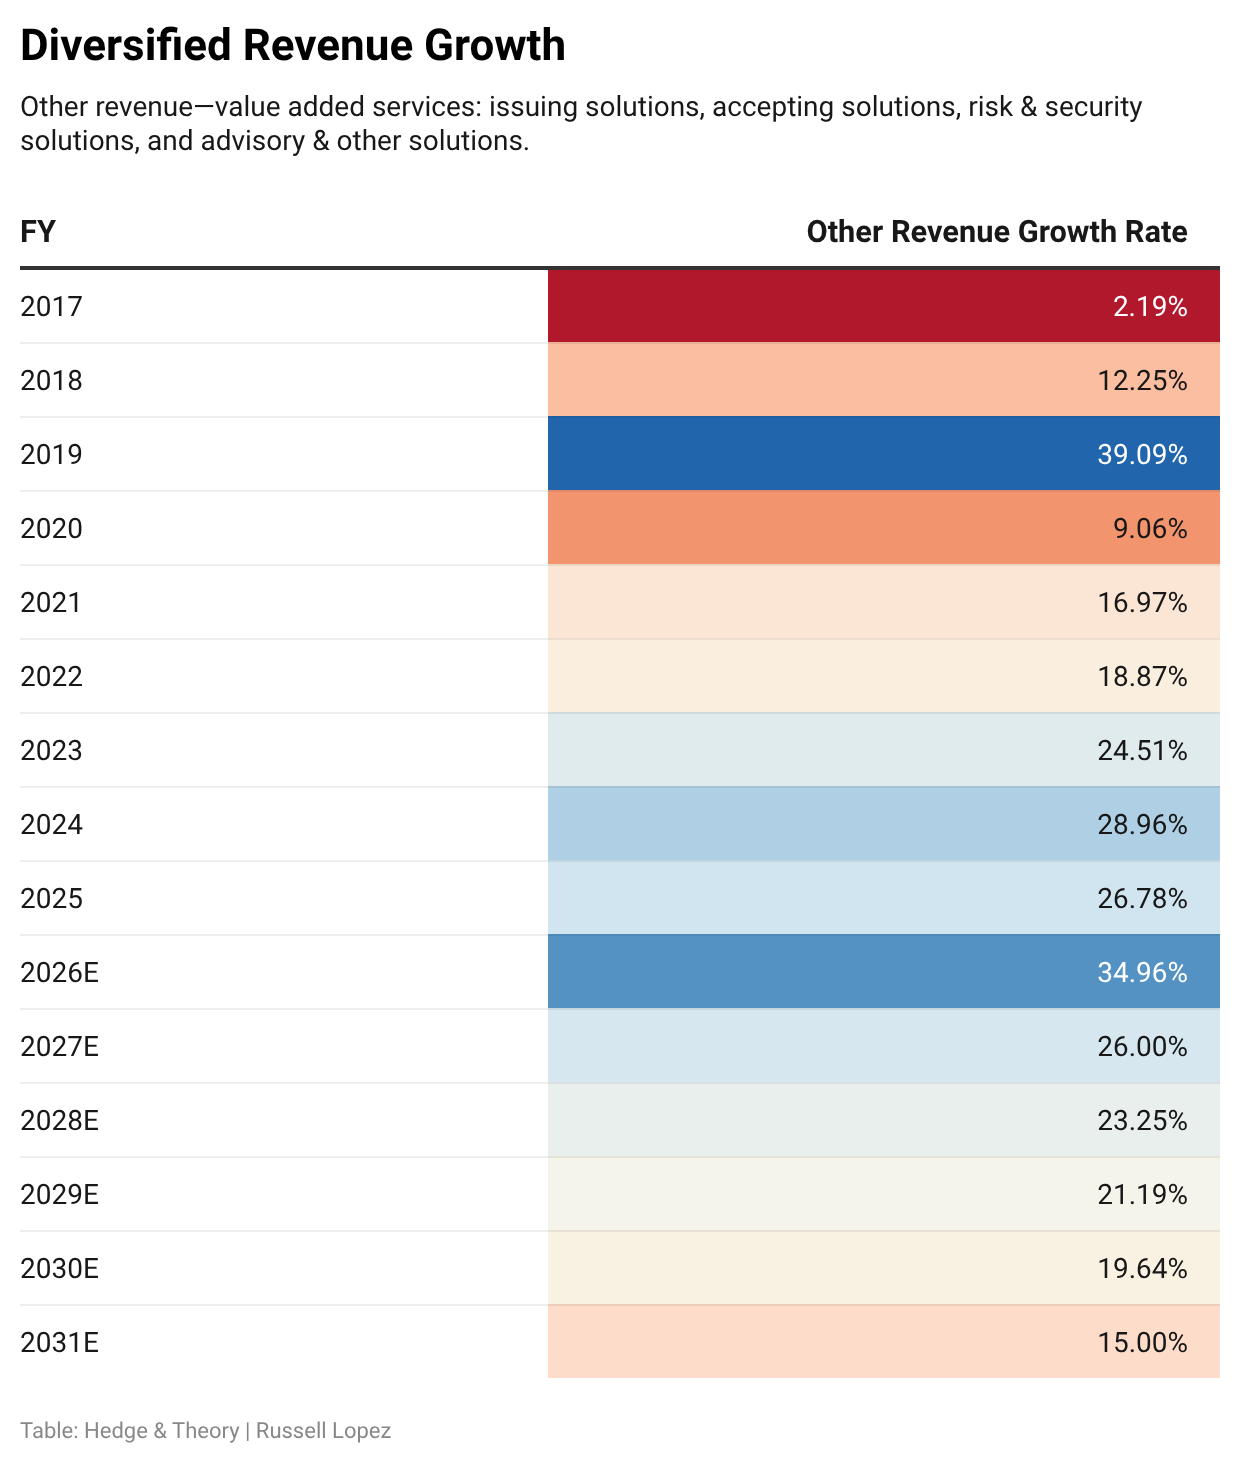
It is clear that payment volume is the main drive behind of Visa’s primary revenue streams including international transaction (cross-border fees), service revenue (fees charged to issuers), and data processing (network fees) which as mentioned previously, is largely determined by macroeconomic conditions but nonetheless resilient to demand shocks, as demonstrated by COVID-19 global lockdowns. On top of all this, an under-looked supporting stream of revenue comes from out other revenue—value added services, which will we shortly see has experienced significant growth, 26.78% in 2025 alone with an averaging growth rate of 19.85% for the last 10 years.
Valuation Summary
In the methodology, unlevered cash flow was computed in standard to the valuation literature, using EBIT as the source of cash flow and an effective tax rate of 17.5% across the board (flat rate) rather than an average of the historical 10-years distorted by the FY2017 TCJA remeasurement. In addition, fiscal years during COVID-19 (2020-2022) were cut as outliers in cash flow projections (due to shutdown in 2020 and an rapid rise in demand in 21-22’).
Visa is minimally leveraged, so, much of the unlevered cash flow will be returned to equity holders. In our model, from 2027 to 2031, cash flow is expected to grow at a steady 8% rate; dwindling from 8.62% to 7.03%.
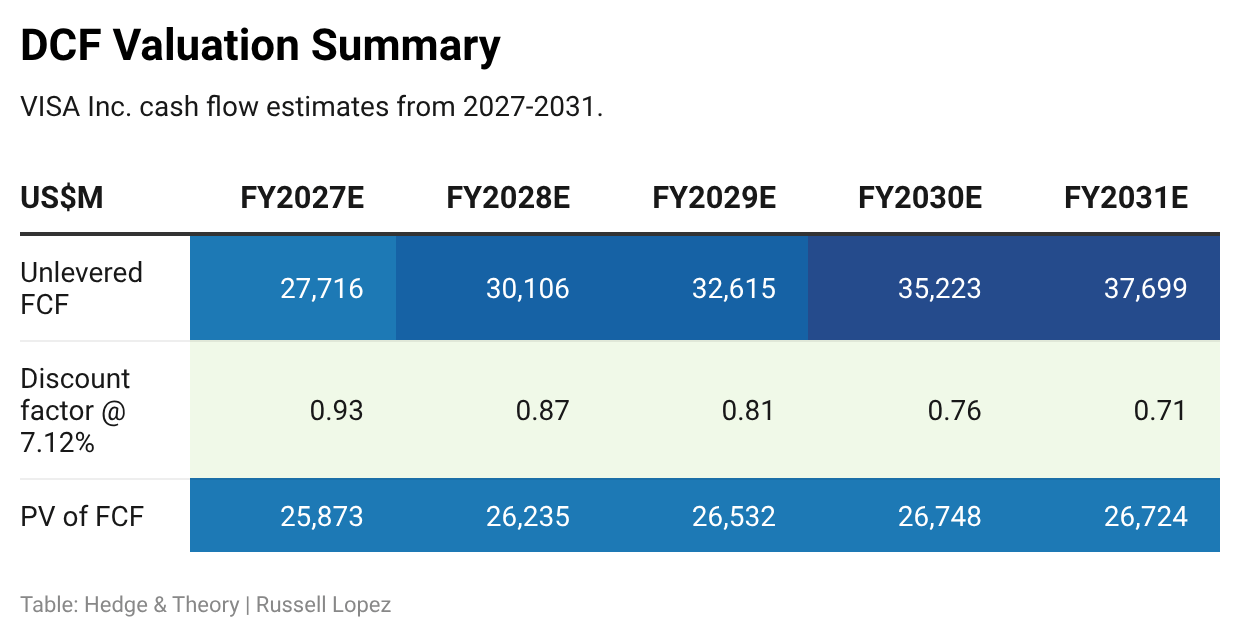
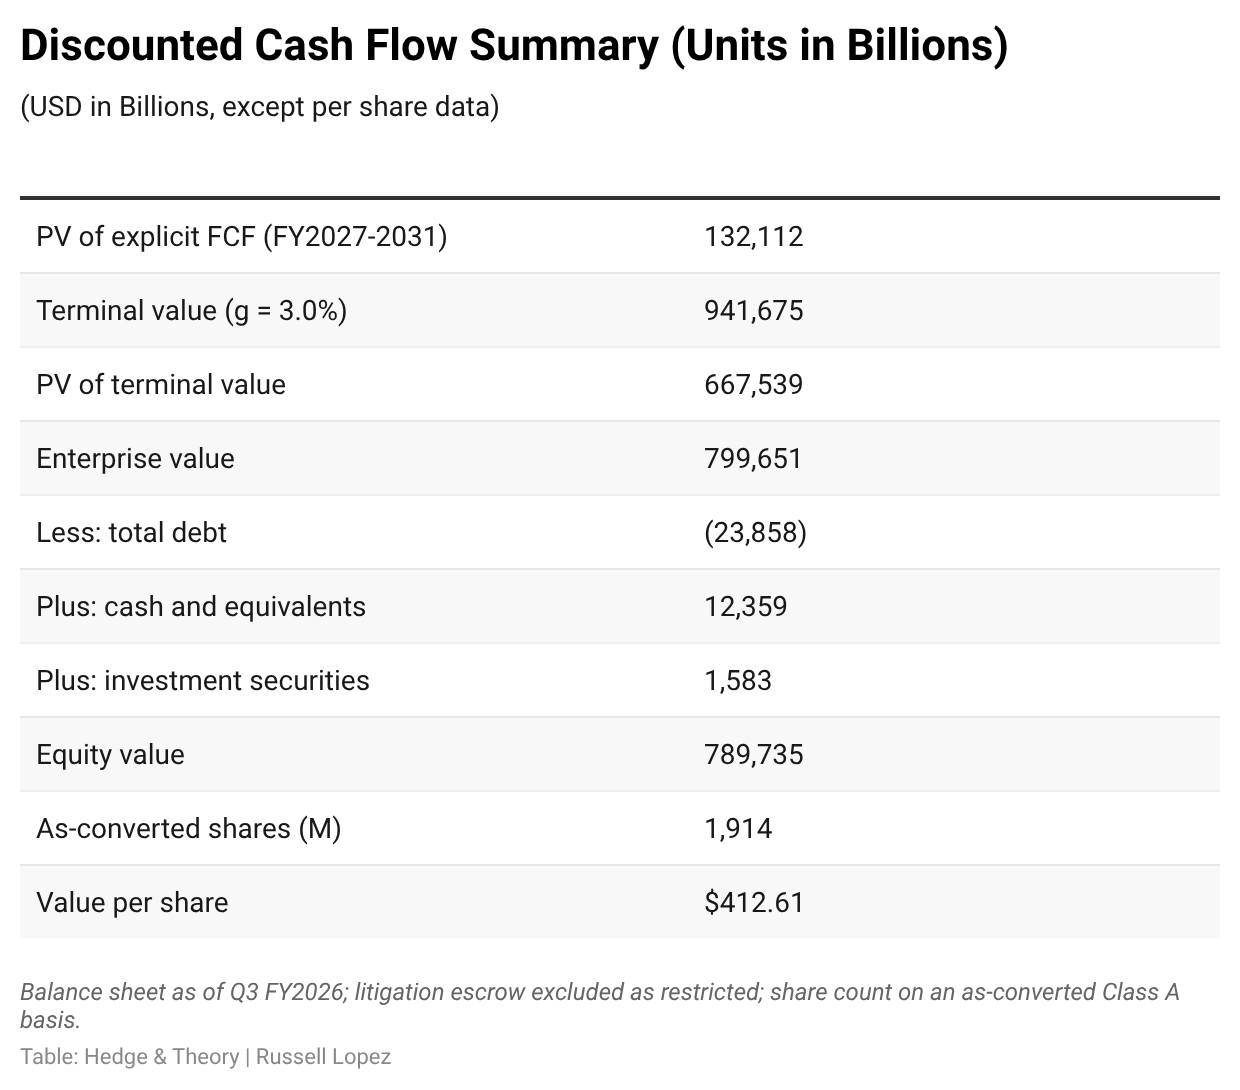
The five explicit forecast years contribute $132.1B of present value, distributed where each year adds between $25.9B and $26.7B, as roughly 8% annual cash flow growth is very nearly cancelled by the 7.12% discount rate. The remaining $667.5bn sits in the terminal value.
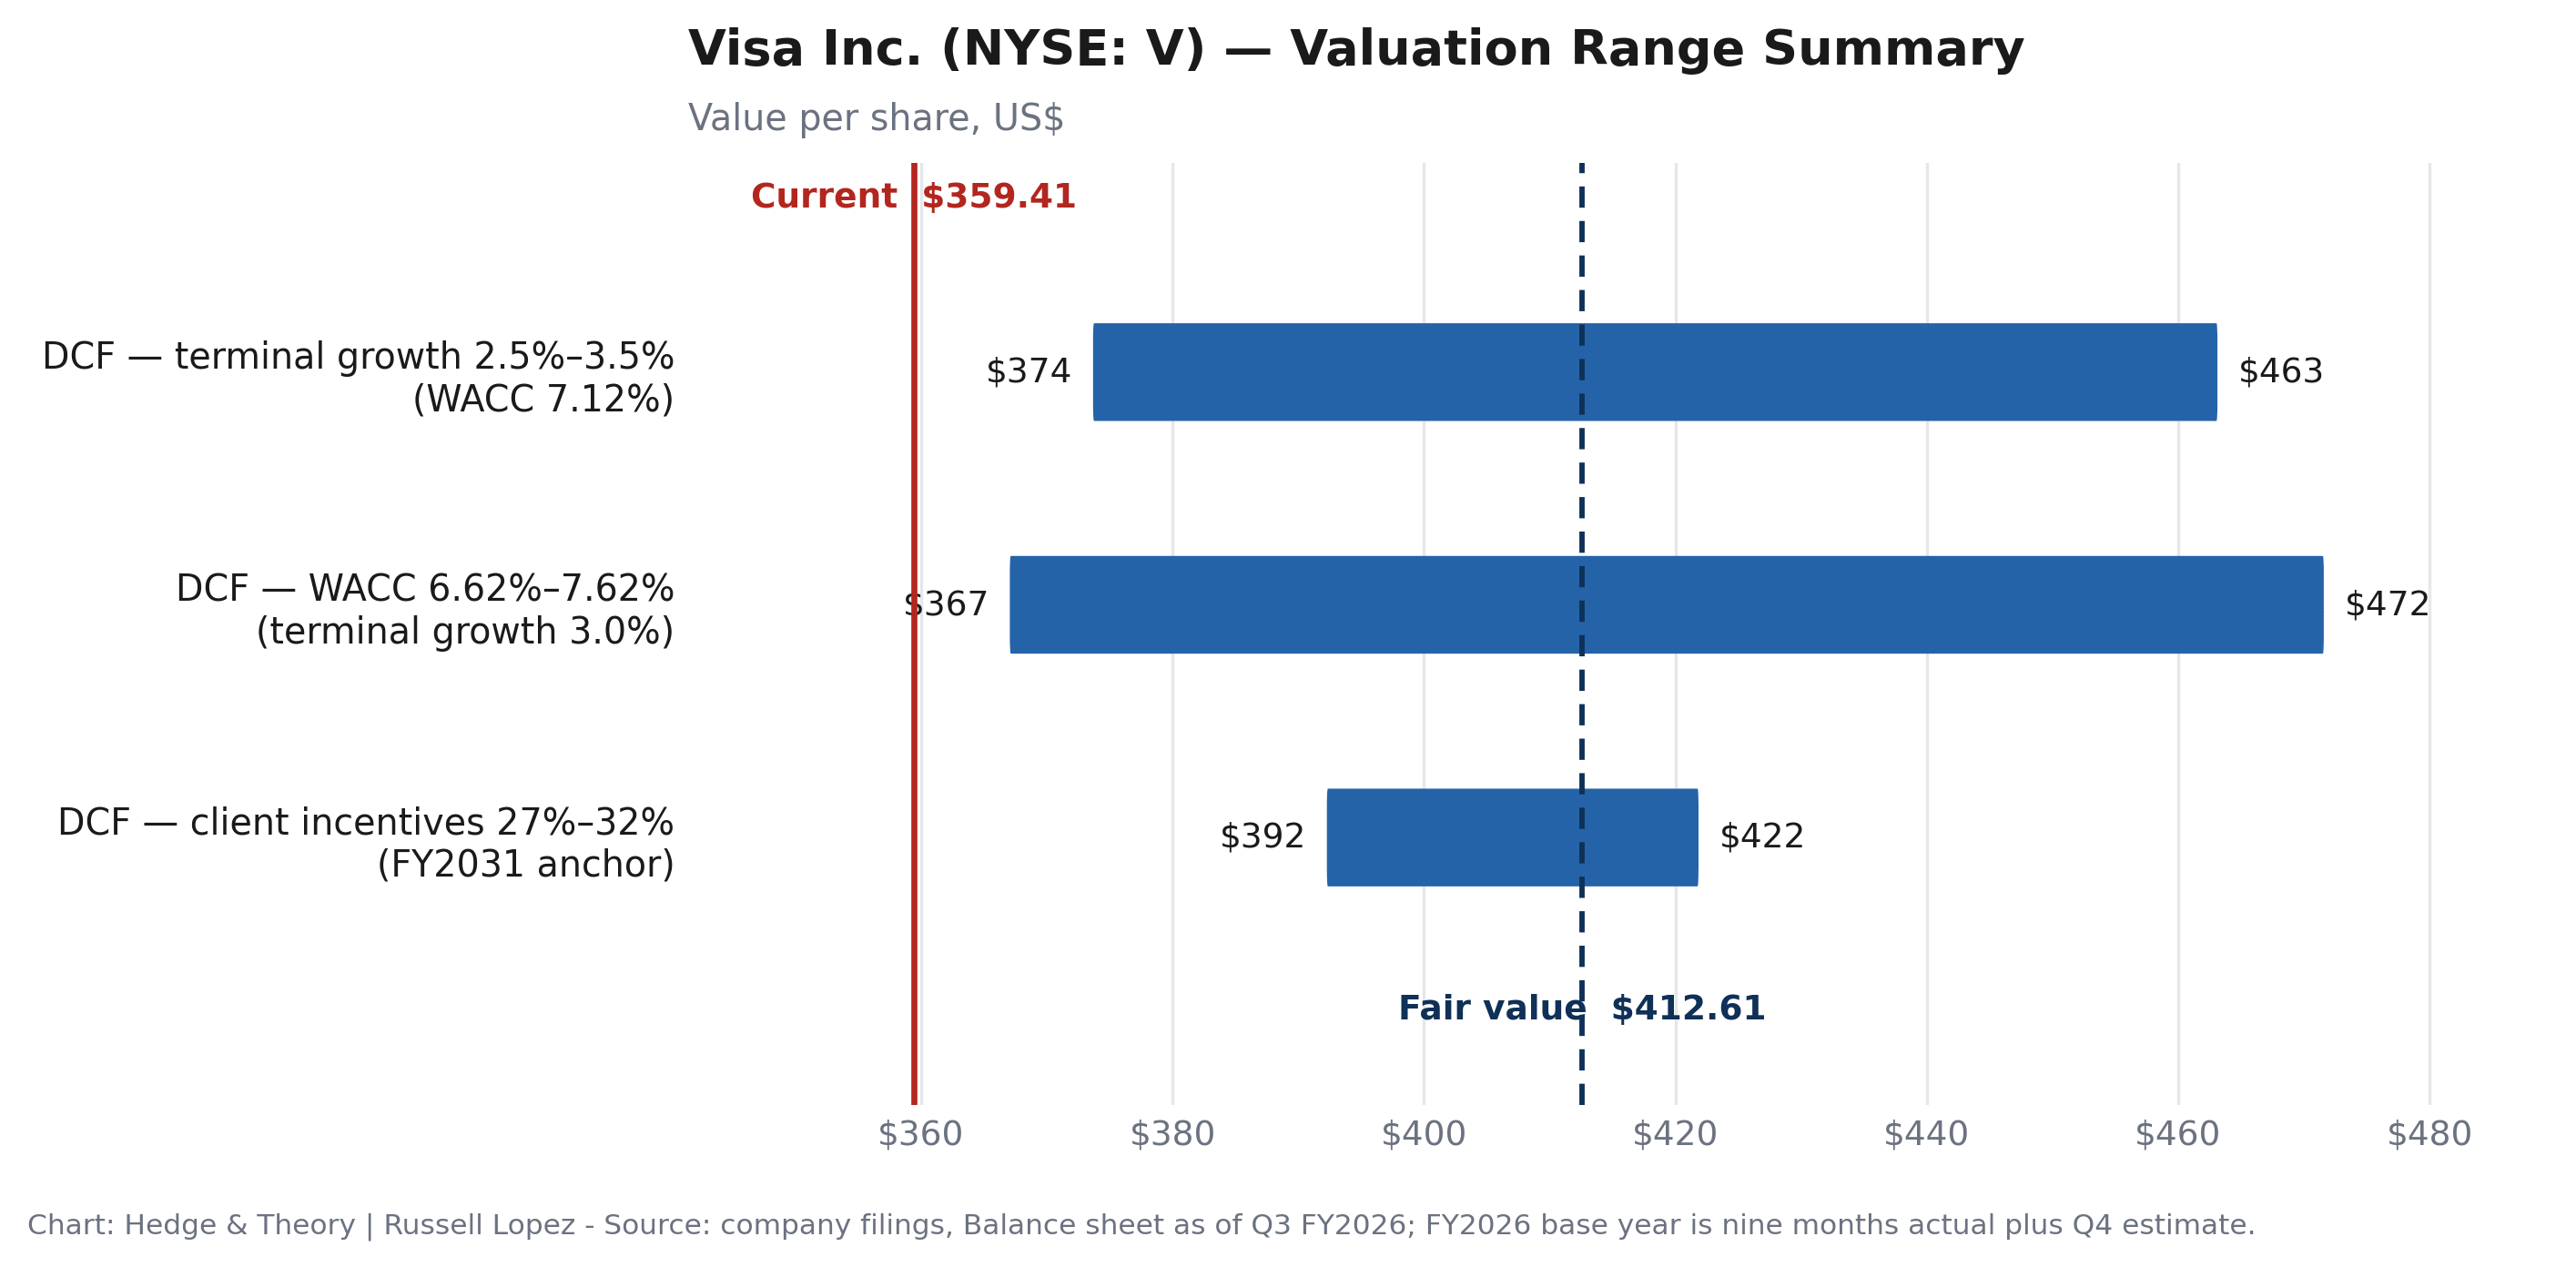
The bridge is short because Visa carries is burdened by a small amount of debt—$23.9bn of borrowings against $13.9bn of cash and investment securities. We exclude the U.S. covered-litigation escrow from cash; it is restricted and economically offset as a liability shield, and of course not available to shareholders or it would overstate equity value. Dividing $789.7B by 1,914M as-converted Class A shares gives the target price of $412.61, around 14.8% above the current market price.
Most of these inputs are deliberately unremarkable. Yields are held flat at FY2026 levels, since ten years of history show no persistent trend in any of the three. Operating cost ratios hold at FY2026 levels; capex and D&A sit near their decade averages. Payments volume fades from 7.2% to 5.8%, converging on nominal consumer spending growth as the cash-conversion runway thins — close to where consensus sits, and intentionally so.
Two inputs carry the valuation. Because debt is 3.4% of market capital, WACC is almost entirely cost of equity, so the 7.12% discount rate reduces to a view on beta and the equity risk premium rather than on capital structure. The 3.0% terminal growth rate assumes Visa’s residual conversion premium above nominal consumer spending has largely decayed by FY2031. Neither is precise, and both are stress-tested below.
One input worth flagging: the 17.5% effective tax rate is the FY2022–25 average rather than the ten-year average of 22.1%, which is distorted by the FY2017 TCJA remeasurement and the pre-2018 statutory regime.
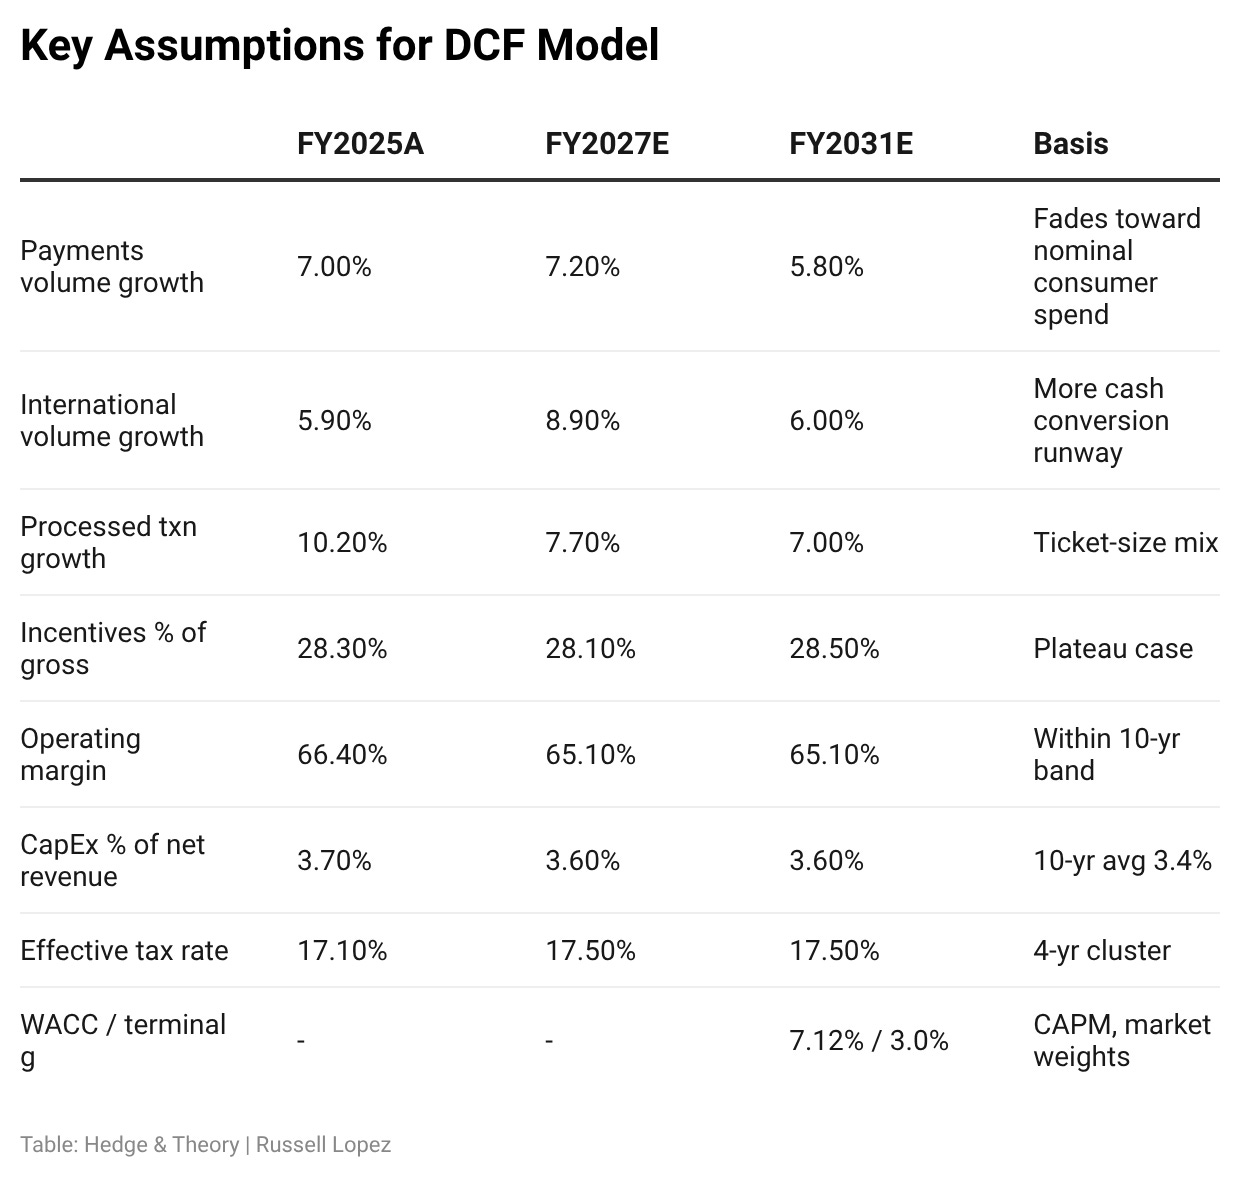
The three diagnostics exist to confirm the model is not quietly assuming its own conclusion. The implied exit multiple of 20.1x is close to where Visa trades today, so no re-rating is embedded on top of the growth forecast. Free cash flow converts at roughly 55% of net revenue across the forecast, consistent with the last decade. Terminal value is 83.5% of enterprise value — high, but that is the honest shape of a business with capex at 3.6% of revenue and a ten-year operating margin band of 2.7 points. It means this valuation is a statement about durability, not about the next five years.
The lower block reverses the exercise: holding everything else constant, what does the current price imply? Visa at $359.41 is priced for 2.29% perpetual growth, a 7.72% WACC, or a 7.88% cost of equity. Each is an ordinary difference of opinion. The fourth is not — for $359 to be right on operating grounds alone, client incentives would have to reach 37.5% of gross revenue by FY2031, against a decade-long trend that extrapolates to roughly 32%. The market is discounting the required return, not the cash flows.
Implied exit multiple = 20.1x
Terminal value as % of EV = 83.5%
FCF as % of net revenue = ~55%
It is clear that the market values Visa as a riskier investment then our model suggests. A 0.6% difference in WACC and 0.62% higher cost of equity implies a greater premium demanded by investors. This is demonstrated further by a 9% difference in client incentives for FY 2031E, signalling the less income and therefore less cash flows pouring back to owners.
Mkt. vs Model
Market-implied terminal growth 2.29% vs. our 3.00%
Market-implied WACC 7.72% vs. our 7.12%
Market-implied cost of equity 7.88% vs. our 7.26%
Market-implied FY2031 incentives 37.5% vs. our 28.5%
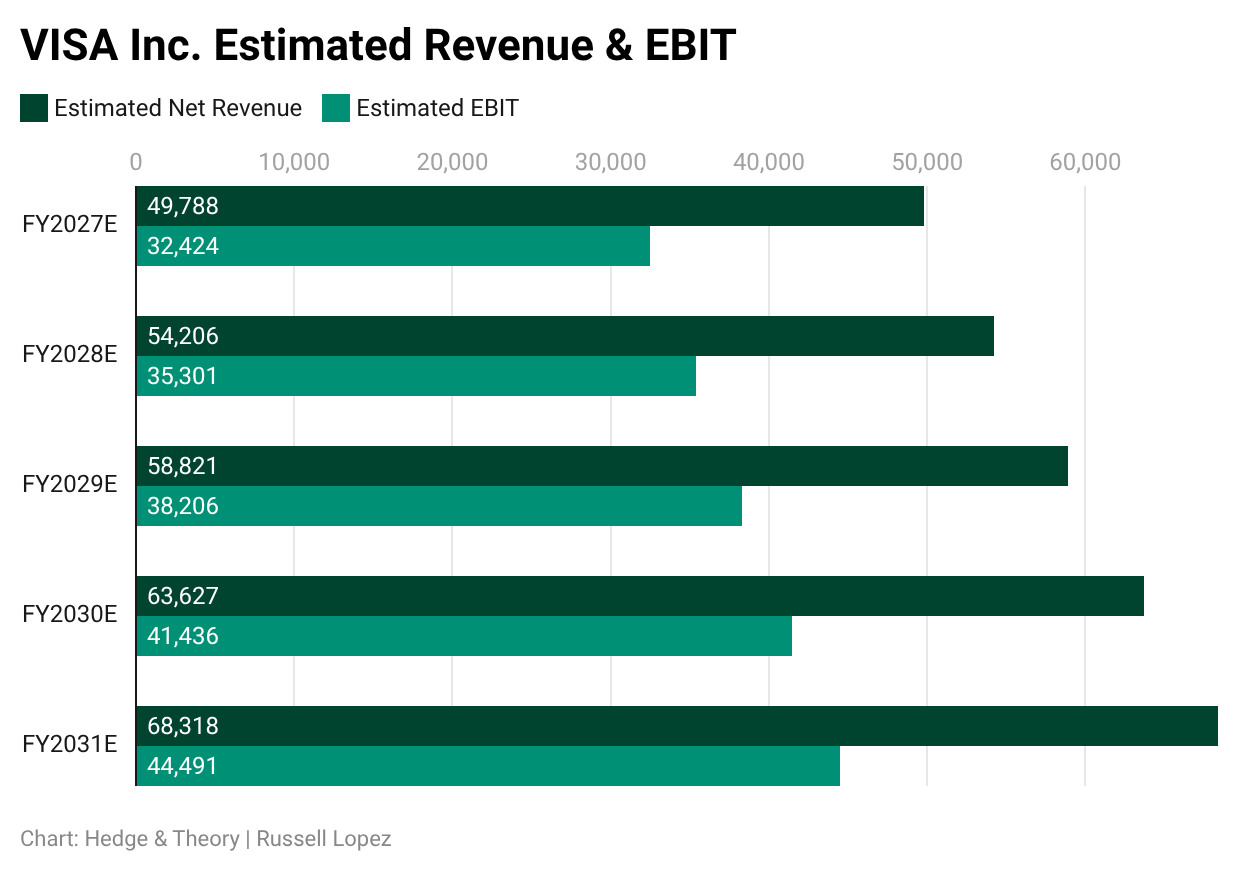
For reference, our estimates for projected revenue and EBIT for the next five years. Not much of showcase as these projections line up well with Wall Street’s. The main variable behind estimated revenue is total payment volume expected to peak at 7.2% in 2027 and drag down to 5.8% in 2031 as economic growth slows in the U.S. but expand globally.
Current market price sits at $359.41 with our estimated fair value at $412.61.
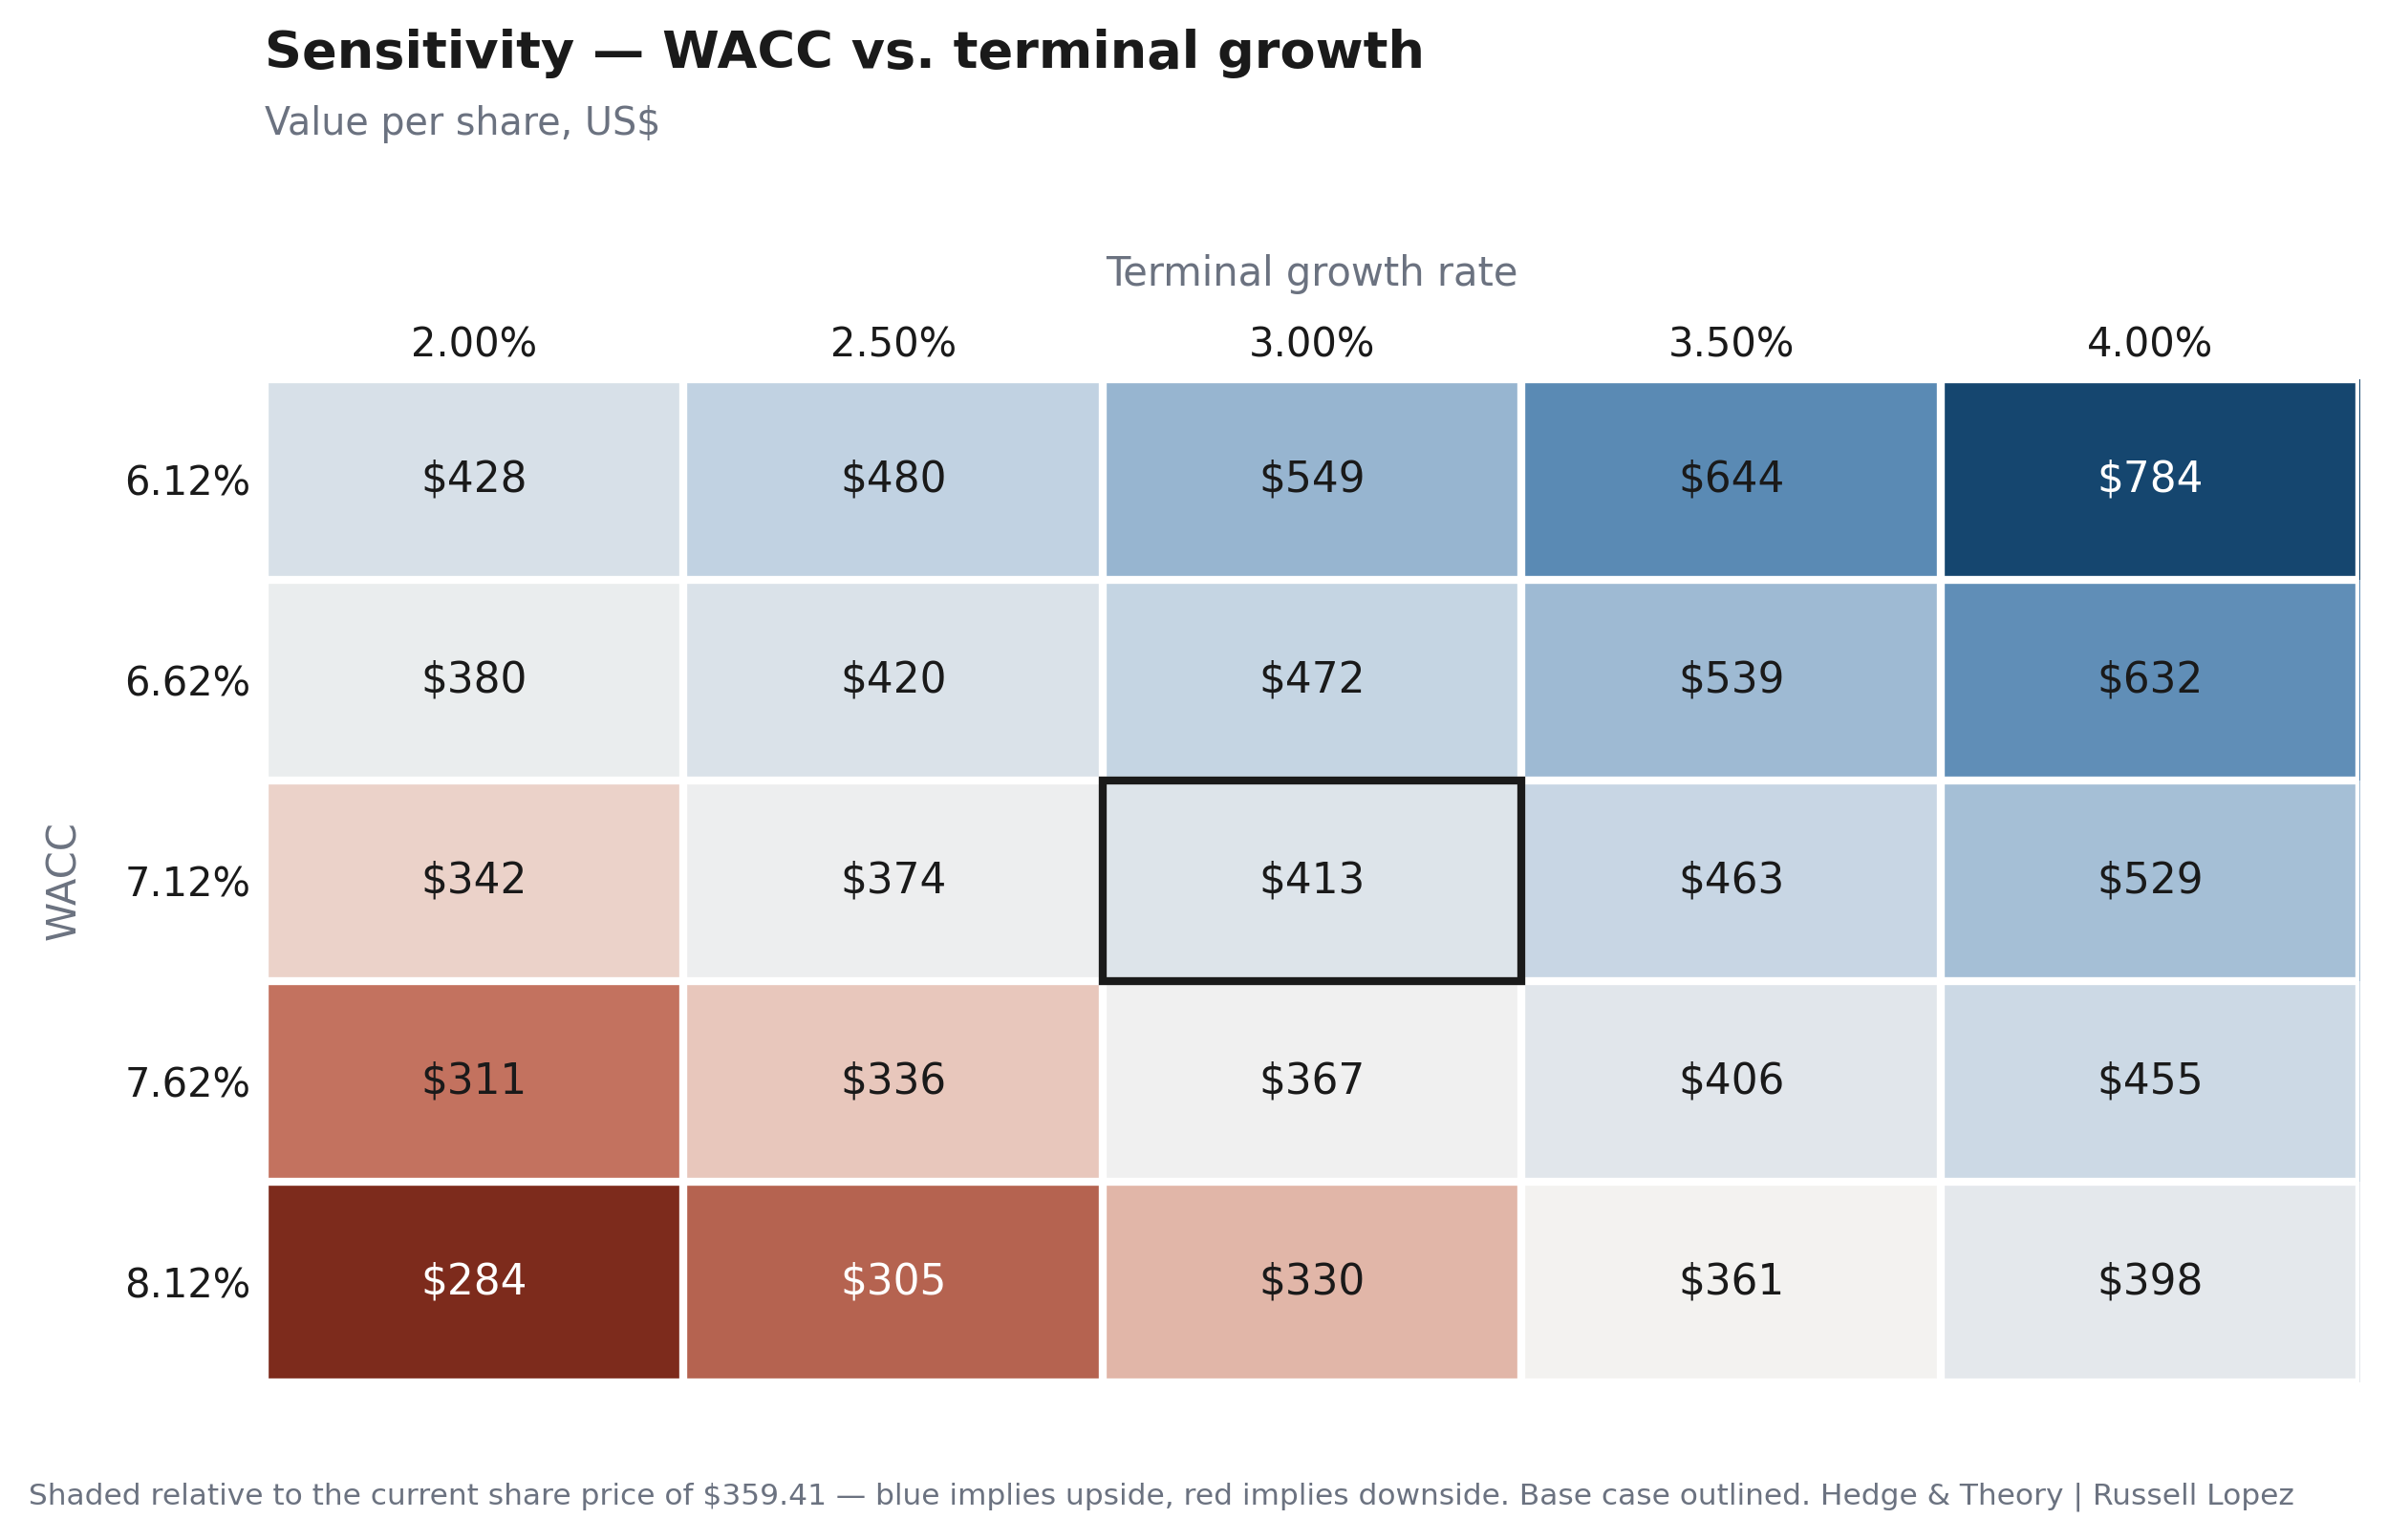
Bear Risks and Sensitivity Analysis.
There faces various bearish situations that could derail the investment thesis, mainly if the weighted cost of capital increases to much due to investors being uncertain that Visa will deliver adequate profits. For a slumping growth rate, this may be due to unprecedented macroeconomic stagnation or even downwards pressure to GDP. The former is not only more plausible but has a greater magnitude effect on the share price if higher than expected, as investors will demand a higher premium to compensate for the business risk.
The biggest threat to that may drive this higher premium is on-going litigation that may drag on towards the future. For instance, there is currently an monopoly lawsuit filed against Visa from the U.S. Department of Justice, claiming an illegal monopolization of the debit card market. This not to mention numerous secondary antitrust laws mainly around alleged inflated transaction costs. Lastly, there historically in the last 20 years, there has been a continuous litigation with Visa and competitors like Mastercard against merchants, claiming unfair fees that bite into merchant profit margins. In 2024, there was a $38 billion settlement from Visa and Mastercard by a U.S. district federal judge.
In 2025 alone, Visa spent $2.5B in litigation provisions, although, a fraction was used to fund their escrow account which adjusts the conversion rate of class B shares into class A shares, preventing operational risk but not taking cash to spend on litigation. Rather, relying on dilution of class B shares to maintain the wealth of class A shareholders. This liability shield for public shareholders should insulate idiosyncratic risk.
Next, the climb in client incentives will reduce the earnings of the company if bargaining power is reduce on Visa’s behalf, forcing higher fees paid out to issuers.
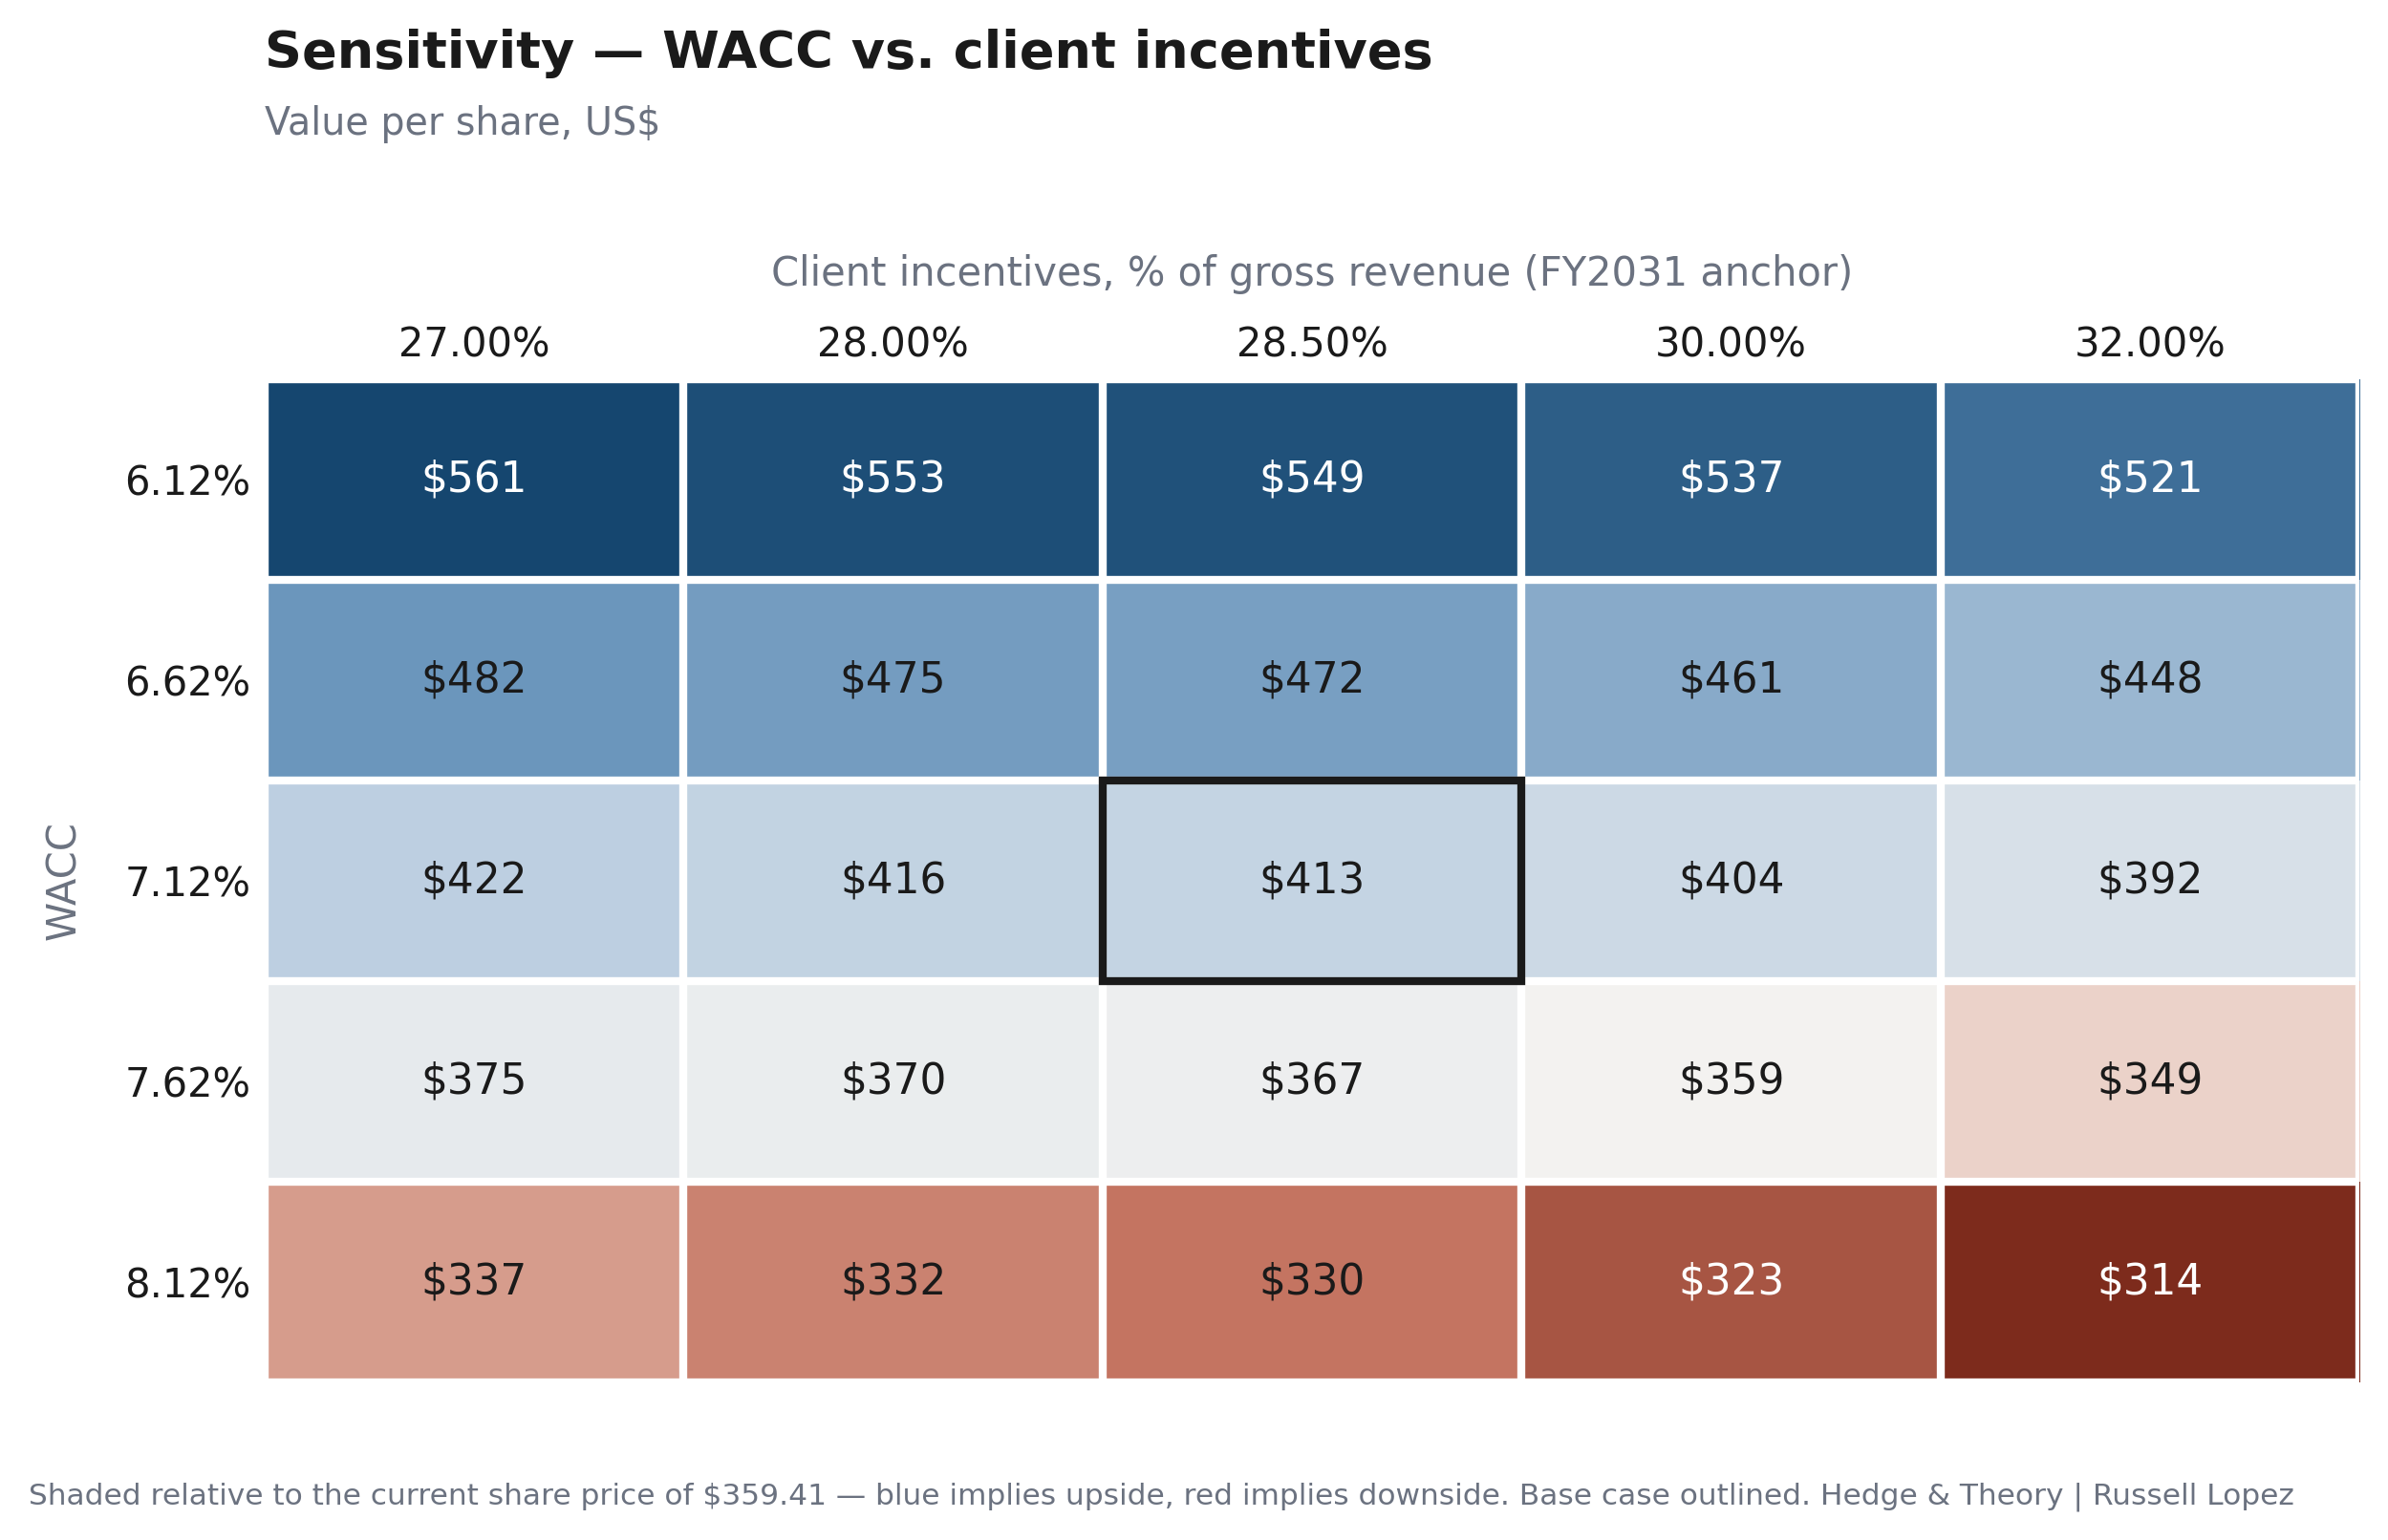
Ultimately, the uncertainty of imposed regulation risk that can cap transaction fees, rates, and other metrics will threaten operation margins.
What to Watch Out For.
The results for the fiscal year of 2026 will be filed officially in the end of October, here, our projections will strengthen or weaken in probability. There are several indicators to keep close watch:
Payment volume
GDP & consumer spending numbers
Federal Reserve possible rate hikes
Other revenue growth rate
Client incentives % of gross revenue
Stock price
Closing Thoughts.
Kind reminder that this report is not financial or investment advice, rather an opinion-based valuation based off publicly available information, therefore, I bear no responsibility to potential financial losses.
If you are interested in more equity reports like this one, please make sure to subscribe with your email, this work will remain free for the foreseeable future. Feel free to visit my website for other research or inquiries.
Finally, for those curious, the appendix with all the original model can be found on my website, thanks again for reading!
The official data for the fiscal year of 2026 has not been released yet, therefore, the following results were calculated using the reported Q4 for 2025 multiplied by the Q3 2026 (YTD, 9 months) YoY growth rates to get the Q4 2026 estimations, which are then added to Q3 2026.